
Close rate sounds like a simple calculation:
Signed jobs ÷ opportunities = close rate
The problem is the word “opportunities.”
Does that mean every lead that contacted the company? Every qualified lead? Every scheduled appointment? Or only the consultations that actually happened?
Each denominator produces a different percentage—and answers a different business question.
That is why remodeling companies can review the same sales activity and report wildly different close rates without anyone technically making a calculation error.
The real mistake is treating those different percentages as if they measure the same thing.
There Is More Than One Useful Close Rate
There is no universally “true” close rate until you define what part of the pipeline you are measuring.
A remodeling company should generally track at least three conversion rates:
- Lead-to-sale rate
- Qualified-lead close rate
- Held-appointment close rate
The company should also track its appointment show-up rate separately.
Together, these numbers reveal where prospects are leaving the pipeline. One blended percentage cannot do that.
1. Lead-to-Sale Rate
The lead-to-sale rate compares signed jobs with every lead generated during the same reporting period.
Formula:
Signed Jobs ÷ Total Leads = Lead-to-Sale Rate
Suppose a remodeling company receives 120 leads and closes 11 projects.
11 ÷ 120 = 9.2%
That number may look low, but it does not automatically mean the sales team is performing poorly.
The denominator includes everyone:
- Qualified homeowners
- Poor-fit inquiries
- Prospects outside the service area
- Projects below the company’s minimum budget
- People who never responded
- Solicitors, job seekers, and spam
- Homeowners who were still in the earliest research stage
The lead-to-sale rate measures the performance of the entire revenue pipeline—from marketing and lead quality through qualification, scheduling, attendance, and sales.
It is a valuable company-level metric. It is not a clean measurement of what happens during the sales conversation.
2. Qualified-Lead Close Rate
The qualified-lead close rate includes only prospects who meet the company’s agreed qualification standards.
Formula:
Signed Jobs ÷ Qualified Leads = Qualified-Lead Close Rate
In our example, 55% of the company’s 120 leads were qualified:
120 × 55% = 66 qualified leads
If 11 of those qualified leads signed contracts:
11 ÷ 66 = 16.7%
This metric shows how efficiently the company converts legitimate opportunities into customers.
It reflects more than sales performance. It also includes what happens between qualification and the consultation:
- Whether an appointment gets scheduled
- How long the prospect waits for the appointment
- Whether the prospect confirms
- Whether the consultation actually occurs
- Whether follow-up continues when the prospect is not immediately ready
If this rate is weak while the held-appointment close rate is healthy, the problem may be scheduling, no-shows, nurturing, or follow-up—not the salesperson’s ability to close.
3. Held-Appointment Close Rate
The held-appointment close rate compares signed projects only with qualified sales appointments that actually occurred.
Formula:
Signed Jobs ÷ Held Appointments = Held-Appointment Close Rate
Suppose 43 qualified prospects completed consultations and 11 signed contracts:
11 ÷ 43 = 25.6%
This is the best rate for evaluating how effectively the company converts completed sales conversations into signed projects.
It helps answer questions such as:
- Is the consultation structured effectively?
- Is the company communicating its value clearly?
- Are expectations about budget and scope being handled well?
- Are proposals delivered promptly?
- Are objections addressed consistently?
- Is post-consultation follow-up strong enough?
If you want to evaluate the sales conversation itself, this is usually the percentage people mean when they refer to a “true close rate.”
But it should not replace the other two rates.
A strong held-appointment close rate can coexist with serious problems earlier in the pipeline.
Track No-Shows Separately
No-shows should not be added to the held-appointment close-rate denominator because no sales conversation occurred.
They should not disappear from reporting either.
Track them using a separate calculation:
No-Show Appointments ÷ Booked Appointments = No-Show Rate
You can also track the positive version:
Held Appointments ÷ Booked Appointments = Show-Up Rate
For example, if the company scheduled 50 qualified appointments and 43 occurred:
43 ÷ 50 = 86% show-up rate
The corresponding no-show rate would be:
7 ÷ 50 = 14% no-show rate
This keeps appointment performance visible without distorting the measurement of completed sales conversations.
One Example, Three Different Answers
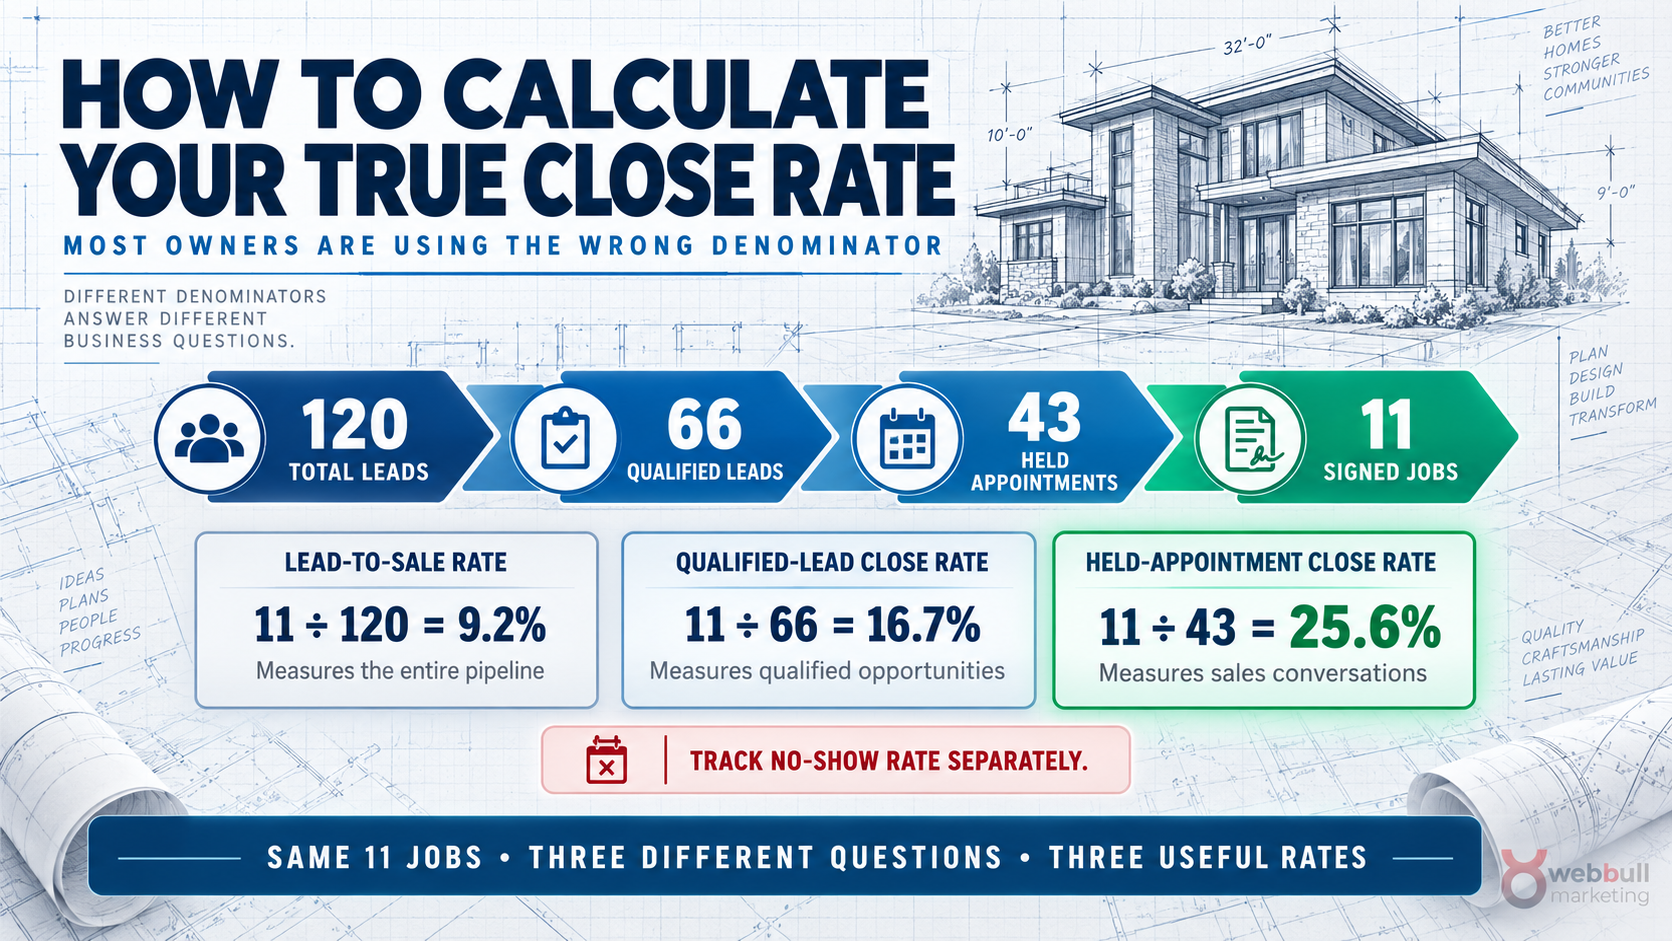
Using the same company data:
- 120 total leads
- 66 qualified leads
- 43 held appointments
- 11 signed jobs
The company has three valid conversion rates:
- Lead-to-sale rate: 11 ÷ 120 = 9.2%
- Qualified-lead close rate: 11 ÷ 66 = 16.7%
- Held-appointment close rate: 11 ÷ 43 = 25.6%
None of these percentages is inherently wrong.
They simply answer different questions.
Metric
What It Measures
Primary Areas to Investigate
Lead-to-sale rate
Performance of the complete pipeline
Marketing, lead quality, qualification, scheduling and sales
Qualified-lead close rate
Conversion of legitimate opportunities
Appointment setting, show rate, nurturing, follow-up and sales
Held-appointment close rate
Conversion after a real sales conversation
Consultation, positioning, proposal, objection handling and closing
Show-up rate
Percentage of booked appointments completed
Confirmation, reminders, wait time and perceived appointment value
Why Owners Often Solve the Wrong Problem
Imagine an owner who sees a 9.2% lead-to-sale rate and concludes that the sales team needs a better script.
That conclusion may be completely wrong.
If many inquiries are outside the service area or below the company’s minimum project size, lead quality or qualification may be the real issue.
Now consider an owner who reports a 25.6% close rate based only on held consultations and assumes the pipeline is healthy.
That conclusion may also be wrong.
The sales team may convert completed appointments effectively while a high percentage of qualified prospects never schedule, fail to attend, or disappear before receiving a proposal.
One rate can look healthy while the overall pipeline is leaking revenue.
Define Every Stage Before Trusting the Report
Accurate calculations require consistent definitions.
Everyone using the CRM should agree on what each stage means:
- Lead: A legitimate new inquiry, excluding spam and vendors
- Qualified lead: A prospect meeting the company’s service-area, project-type, timing, budget, and decision-making criteria
- Booked appointment: A qualified consultation placed on the calendar
- Held appointment: A consultation that actually occurred
- Proposal delivered: A formal proposal or agreement presented to the prospect
- Closed-won: A signed contract that meets the company’s definition of a booked project
- Closed-lost: An opportunity that will not proceed, with a documented reason
If those definitions change depending on who enters the information, the percentages may be mathematically correct while the underlying data remains unreliable.
Compare Matching Time Periods Carefully
Remodeling sales cycles often cross reporting periods.
A lead received near the end of July may not sign until August or September. Dividing July’s signed projects by July’s new leads can therefore create a misleading result.
For quick operational monitoring, monthly stage-conversion reports are still useful. For a more accurate close-rate analysis, use cohorts when possible.
A cohort tracks a group of leads based on when they entered the pipeline and follows those same opportunities until they close or are marked lost.
This prevents deals from one period from being divided by unrelated leads from another.
The Bottom Line
Your close rate is only meaningful when the denominator is clearly defined.
Do not force the entire pipeline into one percentage.
Track:
- Lead-to-sale rate
- Qualified-lead close rate
- Held-appointment close rate
- Appointment show-up rate
Then use each number to diagnose the part of the pipeline it actually measures.
The same 11 signed projects can produce a 9.2%, 16.7%, or 25.6% conversion rate. The right number depends on the question you are trying to answer.
Define the question first. Then choose the denominator.
That is how you stop blaming sales for marketing problems, stop blaming marketing for appointment problems, and start fixing the stage that is actually limiting revenue.